
More and more advertisers are flocking to Facebook as a way of capitalising on the social network’s huge audiences, rich user data and the assurance of only paying for a conversion, a click or an impression (and hoping for more).
Facebook earned $8.8 billion in Q4 2016, almost all of which came from revenue gleaned off the back of its various ad options. Unfortunately, a clear view of earnings does not extend to the very people that spent that money. Many of the advertisers that plunge billions into targeting audiences on the network are unable to evaluate the genuine impact and ROI of their campaigns.
If you’ve ever dabbled in Facebook ads, you’ve probably felt dizzy looking at all the different reporting metrics. There’s reach, relevance score, positive feedback, messaging replies, video watches at three different percentage points, canvas view time, unique mobile app sessions… the list goes on and on.
For a wade through the smokescreen towards determining your true ROI, conversions will put things in plain English. In this article (we have more if you want), we’ll help you along the way by looking into the following:
- How to install conversion tracking for your Facebook ads
- How to use UTM tags and cross reference performance in Google Analytics
- Understand how Facebook reports conversions (attribution)
Step 1: Install the basics
To begin measuring your campaign performance, we need to install the Facebook base pixel. It is a site-wide piece of code, like Google Analytics, which measures how users interact with the pages throughout your domain.
Once you’ve installed the base pixel you’ll need to check it’s been implemented correctly. You can do this in two different ways:
- Using the Facebook Pixel Helper – a troubleshooting feature which verifies that everything is in working order.
- Checking that your Facebook pixel ‘fires’ roughly match your Google Analytics pageviews.
![]()
With that installed and tested, it’s time to implement a few features. These features allow you to track conversions that derive from your Facebook ad spend. Let’s start with custom conversions.
Custom conversions
This is the simplest way to set up your conversion tracking in Facebook as it doesn’t require any modifications to the pixel code.
First, you will need a destination URL which you assign to each specific conversion. For example, if a user completes a lead form on your website and is directed to /thank-you, this is the URL you will assign to your custom conversion. The Facebook blog offers a handy step-by-step guide for setting this up.
If you’d rather go down a different and arguably more technical route, you can set up conversion tracking via standard events. This will give you a few additional features but at the expense of a little more time and complexity in the setup phase. Here’s Facebook’s own account of the differences: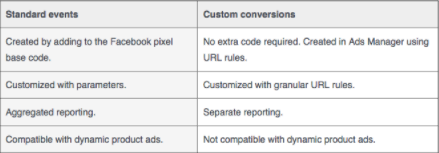
Standard events
Standard events require modification to the base pixel code. There are nine standard events in total, all of which can be utilised to track performance.
For example, the “lead” standard event would require you install one extra piece of code to your /thank-you URL. Standard events provide more flexibility and allow you to send dynamic conversion data back into the ad platform. E-commerce advertisers can utilise the “Make purchase” standard event which can report the actual value of each order.
Notes: There will be a handful of options to pursue after your tracking is up and running. One of these is Advanced Matching, which allows you to layer additional customer data for remarketing efforts. Regardless of how deep you want to go, we recommend that you apply values to every action.
Let’s say you are promoting a high-end training course. You know that one in 10 leads converts into a sale worth £4000. If you apply a £400 value to each lead, this will help you better understand the ROI of each campaign.
Step 2: UTM Tagging and Cross-referencing with Google Analytics
The setting up of conversion tracking means you’re much closer to being able to accurately measure the performance of all that money you’re parting with. The only problem is that you’re relying 100% on Facebook’s reporting. The ad platform is saying that you are generating 27 leads and 343 clicks, but is that really the case?
UTM Tagging
By applying UTM tags to our ad URLs, we can send additional information back to Google Analytics for an extra layer of data and some much-needed peace of mind.
If you utilise conversion tracking in Google Analytics (and you really should) you can cross reference its data with your reports from Facebook as well as viewing performance metrics such as bounce rate and time on site.
Google Analytics and Facebook attribute conversions in different ways, so you can expect discrepancies. However, in these gaps we find a realistic middle ground.
Without UTM tags, all of your Facebook traffic will be uncategorised in Google Analytics, so you won’t be able to segment traffic from your page and the specific campaigns you are running through Facebook ads. The simplest way to create a UTM tag is via the Google URL builder. Simply insert the landing page URL and complete the following fields:
- facebook = Campaign Source
- cpc = Campaign Medium
- the name of the campaign in Facebook = Campaign Name
- You can either create specific tags for each ad or ad set. = Campaign Content
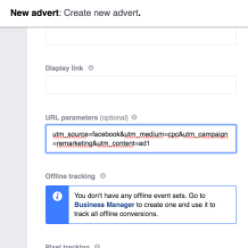
If you were testing three ad variations and you wanted to measure the bounce rate and average visit duration from each ad, you’d create three unique UTM tags – e.g content=ad1, content=ad2, content=ad3.
Remember, you need to create unique UTM tags for each campaign, ad set or ad for the data in Google Analytics to be accurate. If you’re using Facebook’s Power Editor to create multiple ads, don’t forget to customise your UTM tags as you replicate campaigns, ad sets and ads.
Facebook provides a “URL Parameters” field when creating and editing ads. To utilise this, add your landing page URL as normal and then apply everything after the question mark into the “URL Parameters” field, like below:
Cross-referencing
Once you’ve collected enough data, you can then log-in to Google Analytics and start cross referencing your performance. Within the dashboard, select Acquisition > All Traffic > Source / Medium > , at which point you should see Facebook / cpc. Select this for an overview of your overall Facebook ad performance.
If you want to understand how each campaign performs, select secondary dimension and then campaign. If a campaign has a very low average time on page or high bounce rate, you may need to adjust your targeting to improve performance. Most importantly, if you have goals setup in Google Analytics, you can cross reference these with Facebook’s ad-reporting columns.
Notes: It may be that discrepancies in the data rear their head, which can be for a number of reasons. However, it’s most likely related to the ways in which different platforms attribute conversions rather than anything with how you set things up.
Step 3: Understand how Facebook attributes Conversion
An overview of what you pay for lies within Facebook’s attribution policy. The rules that dictate its own version of a desired response, like a conversion. This is how Facebook defines attribution on the platform:
“Facebook credits (or attributes) actions to your ad if someone viewed or clicked your ad and then took an action within a specified time period.”
Definitions of the two actions are as follows:
- Clicks: “A person clicked your ad and took an action. This is a click-through attribution.”
- Impressions: “A person saw your ad, didn’t click it, but took an action within the attribution window. This is a view-through attribution.”
Attribution window
And what of the ‘attribution window’ in this instance?
“By default, your attribution window is set to 1-day view and 28-day click, which means you see actions that happened 1 day after someone viewed your ad and up to 28 days after someone clicked your ad.”
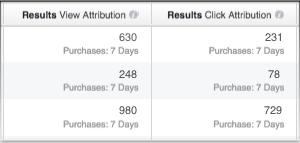
This essentially means that when Facebook reports you have 27 leads, these can include people who didn’t click your ad. The ratio of click/ view-through conversions will vary for each advertiser. But we have found a 50/50 split to be quite typical.
To uncover how these conversions are split, you need to customise the columns in the Facebook reporting dashboard, the details of which can be found here.
Once these columns are enabled, you will see a breakdown of click and view-through conversions, like so:
Notes: If you’ve set up a dedicated URL with a custom conversion, you need to remember this. Each time a user visits that page, it will class as a conversion. More sophisticated ad platforms like Google AdWords allow you to select only “unique” conversions, in order to filter duplicates.
At the time of writing, Facebook does not provide such an option. Thus, if you’re seeing overinflated numbers with Facebook, the chances are you’ve had a few dupes.
To summarise, in order to truly understand your Facebook ad performance, you only need one thing. Understand how conversions are attributed and cross reference with Google Analytics whenever you see fit.
Many advertisers take the numbers provided by Facebook at face value whereas in reality, it only tells half the story.


Share